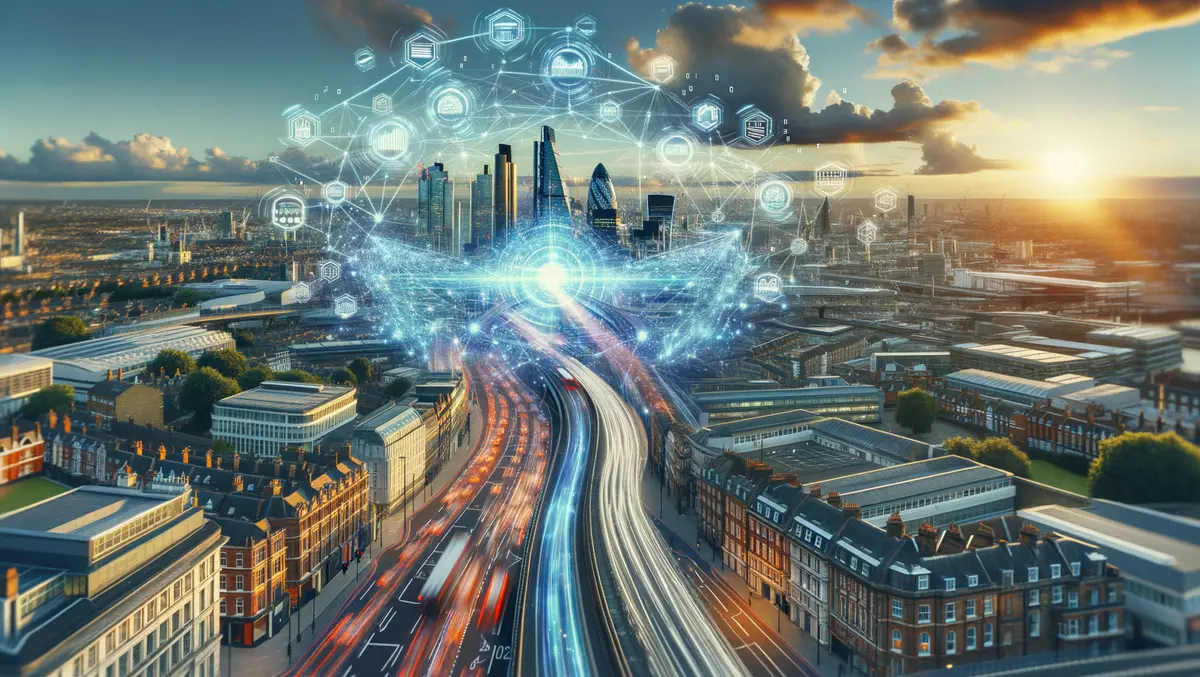
How advanced digital technologies are making London roads work better
With the famous legacy of the Tube and Overground lines, Transport for London (TfL) is the integrated transport authority responsible for transport in London. What may be less well-known about TfL is that it runs the day-to-day operation of London's entire public transport network and is responsible for keeping all of London's busy main roads as congestion-free as possible.
And that's a formidable task. TfL data suggests that on an average day, there are around 5m road journeys, and one in eight of all journeys in London take place on the road network.
That equates to over 3.7 billion trips per year—a large volume of vehicles to manage and keep moving efficiently, says Andy Emmonds, the organisation's Chief Transport Analyst.
Managing this network is a complex, intricate challenge. In fact, monitoring it alone is a technical feat when you consider there are 65,000-plus roads. Reacting to incidents on those roads is essential because London experiences 20,000 unplanned transport incidents yearly, and each minute left unaddressed means traffic builds and builds.
There is a serious cost to road congestion, as it sets back London £5.1 billion per year in lost productivity, which is the average value of earnings that drivers could be making if they weren't sitting stuck behind a wheel.
But the negative consequences of gridlocked streets go far beyond that. There's also the stress and inconvenience for road users, pedestrians, and residents; plus there's the health and environmental impacts of the CO2 all that traffic generates every day.
In addressing these inefficiencies, one of the challenges for TfL was that it was taking between 14 and 17 minutes to detect a traffic incident. By the time it was spotted and interventions put in place, an average total of 27 minutes had been lost in terms of traffic buildup.
The solution Emmonds and team identified was to bring together real-time data on all those roads so they could spot an incident not when it flashes up on CCTV in the TfL traffic control centre but before it becomes a problem and so head it off.
Emmonds had been exploring two advanced forms of computer simulation and modelling to see if they could help: a digital twin and a form of business database, graph technology.
A new approach to working with data at scale
A digital twin is a virtual reproduction of a real-world process. In industry, this means things like power stations or big manufacturing and distribution processes. In Transport for London's case, it's the transport network and examining if/then scenarios.
After extensive evaluation of the latest technology to create and sustain such a highly complex model, Emmonds selected graph technology. If you're not familiar with graph technology, it is a way to represent and model information in ways that make connections very clear. If this makes you think about a Facebook or a LinkedIn network, you'd be right, as these companies are built on leveraging the power of the social graph.
Prior to digital twins and graphs, TfL's approach to working with distinct data sets meant the organisation could only answer a fraction of the questions the team wanted to ask. The problem wasn't enough data—it was collecting terabytes (1,000 gigabytes) of data every week—but how that data was stored and analysed. As a result, no meaningful conclusions could be drawn based on the relationships in these datasets.
Emmonds says, "We were effectively managing this in Excel, and so none of this data was aligned or real-time. What we needed was to be a real-time operator—and to do that, we needed a digital twin."
Emmonds is also now convinced that graphs are the most efficient and performant way to power the digital twin. Graphs are great at uncovering hidden but useful relationships and patterns across data to make the decisions needed to predict and handle traffic incidents. Graphs enable people to store and examine the connections between data points much in the same way commuters think about the routes and connections in their daily travel.
A vision of a smoother-flowing London traffic system
Emmonds comments: "We found that real-time data can only be solved by a graph database because a graph database is an agile and adaptive way to interpret granular data at scale.
"Trips and routing can only be efficiently managed through such a database. We set up a test product which was fed data powered by graphs that could tell us in near real-time if there was a problem on the road. On the day of the test, the system detected five incidents that the control room didn't pick up. For us, that was the proof."
With its new graph-based road traffic analytics console, TfL now connects and feeds its datasets into the digital twin, with the latter set to play a central role in TfL's overall vision of cutting congestion by 10%. When that's achieved, £600m worth of productivity will be returned to Londoners and the capital's many visitors.
Emmonds may even include future-proofing for even more data-based road traffic management innovation in the future, e.g., autonomous vehicles.
That's because, he concludes, the new digital twin and graph-based architecture is 100% open and agile, so there's "nothing stopping us".

